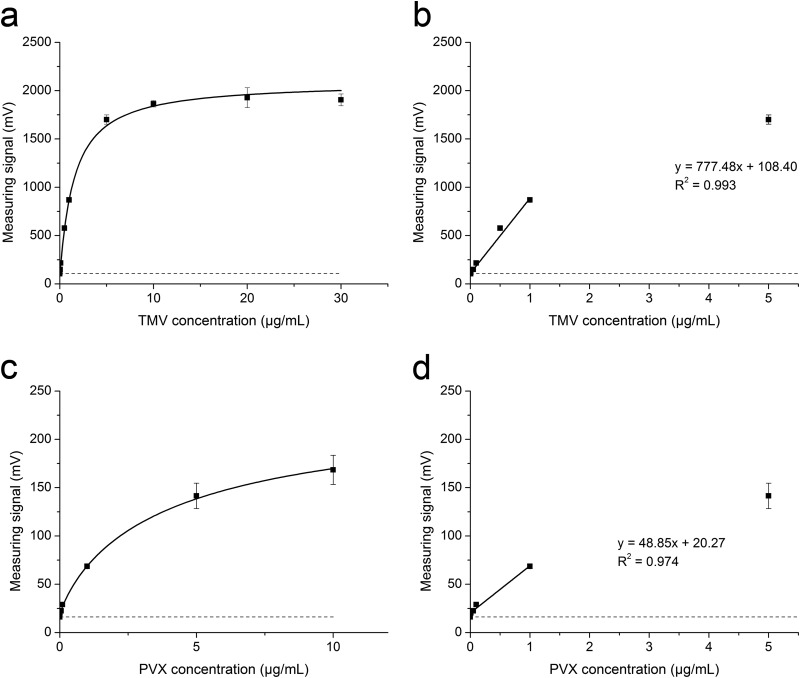
FIG 7.
Calibration curves for the magnetic immunodetection of TMV (a) and PVX (c) and the linear range of calibration with the corresponding linear fits and coefficients of determination (R2) for TMV (b) and PVX (d). All experiments were carried out in triplicate using the sequential assay protocol. Data points in panels a and c were fitted to a nonlinear Hill-1 curve. Blank values are plotted as dashed lines. Data are shown as means ± SDs (n = 3).

