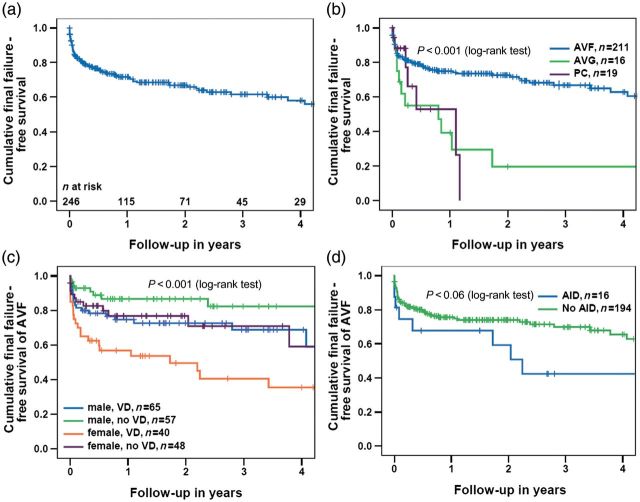
Fig. 1.
(a) Overall final failure-free survival of the first permanent vascular access over time, (b) overall final failure-free survival, stratified by the type of vascular access, (c) final failure-free survival of AVF, stratified by gender and vascular disease and (d) final failure-free survival of AVF, stratified by AID. AVF, native arterio-venous fistulas; AVG, arterio-venous graft; PC, permanent catheter; VD, vascular disease; AID, autoimmune disease. P-values (log-rank test) between subgroups in (b): AVF versus AVG: P < 0.001; AVF versus PC: P = 0.055; AVG versus PC: P = 0.8; AVF versus AVG and PC: P < 0.001.

