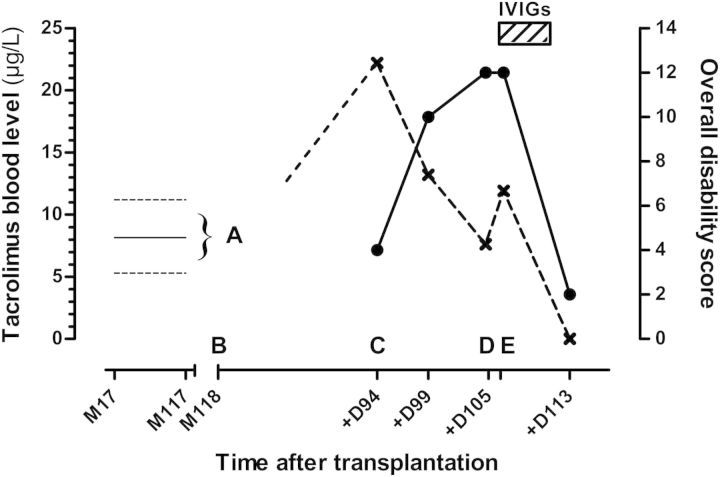
Fig. 1.
Tacrolimus whole blood levels (cross symbols) and clinical findings over time following transplantation. 0 = graft; M = month post-graft; D = days after 1st neurological manifestations; IVIGs=intravenous immunoglobulins. Overall disability sum score (filled circles) was retrospectively calculated according to Merkies ISJ et al., J Neurol Neurosurg Psychiatry, 2002. Tacrolimus whole blood levels were quantified by means of an immunoassay. (A) Variations of tacrolimus levels from M17 to M117 (full line = mean level, dotted lines = highest and lowest levels ever measured). (B) Onset of neurological manifestations at M118 = D0. (C) First neurological impairment at D94. (D) Switch from tacrolimus to sirolimus and beginning of IVIGs at D105. (E) First clinical improvement at D106.

