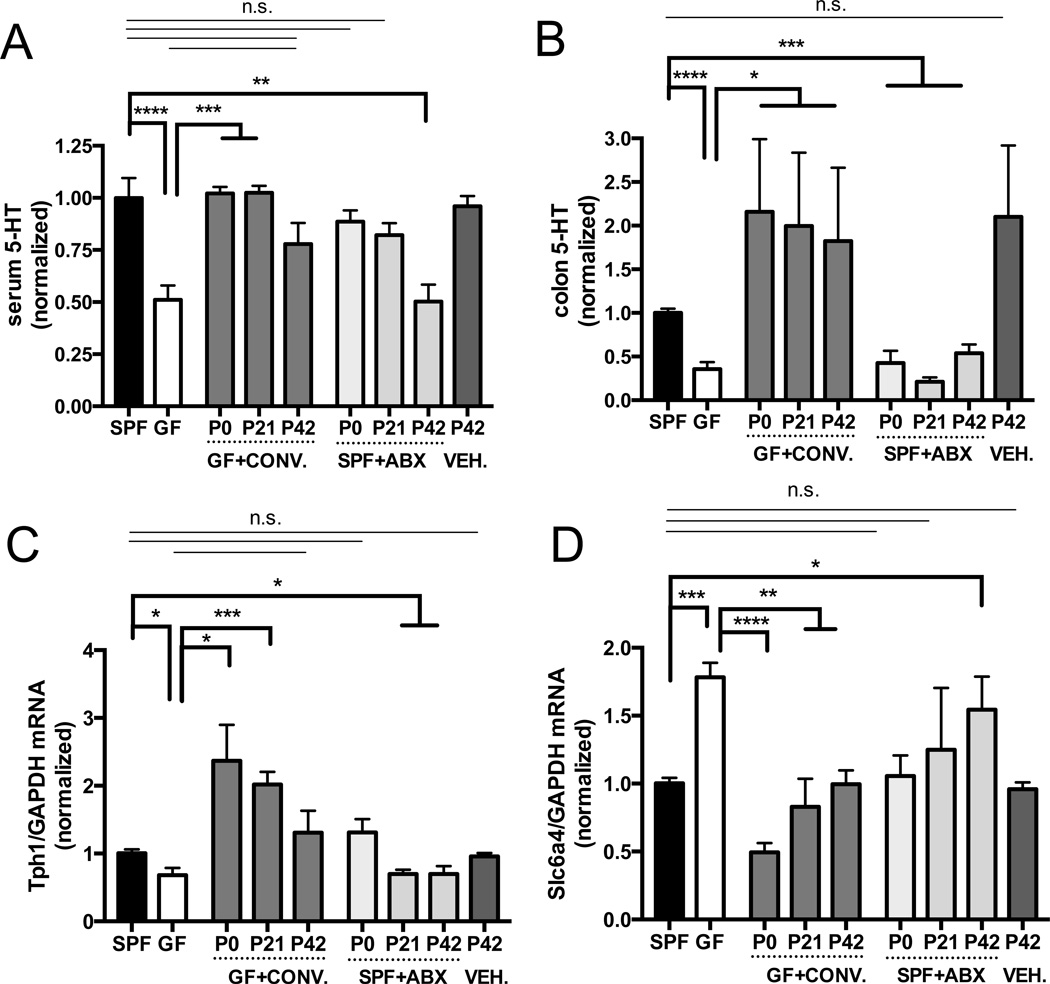
Figure 1. The Gut Microbiota Modulates Host Peripheral Serotonin Levels.
(A) Levels of serum 5-HT. Data are normalized to serum 5-HT in SPF mice. n=8–13.
(B) Levels of colon 5-HT relative to total protein. Data are normalized to colon 5-HT relative to total protein in SPF mice. n=8–13.
(C) Colonic expression of TPH1 relative to GAPDH. Data are normalized to expression levels in SPF mice. n=4.
(D) Colonic expression of SLC6A4 relative to GAPDH.
Data are normalized to expression levels in SPF mice. n=4. Data are presented as mean ± SEM. *p < 0.05, **p < 0.01, ***p < 0.001, n.s.=not statistically significant. SPF=specific pathogen-free (conventionally-colonized), GF=germ-free, CONV.=SPF conventionalized, ABX=antibiotic-treated, VEH=vehicle (water)-treated. See also Figure S1.

