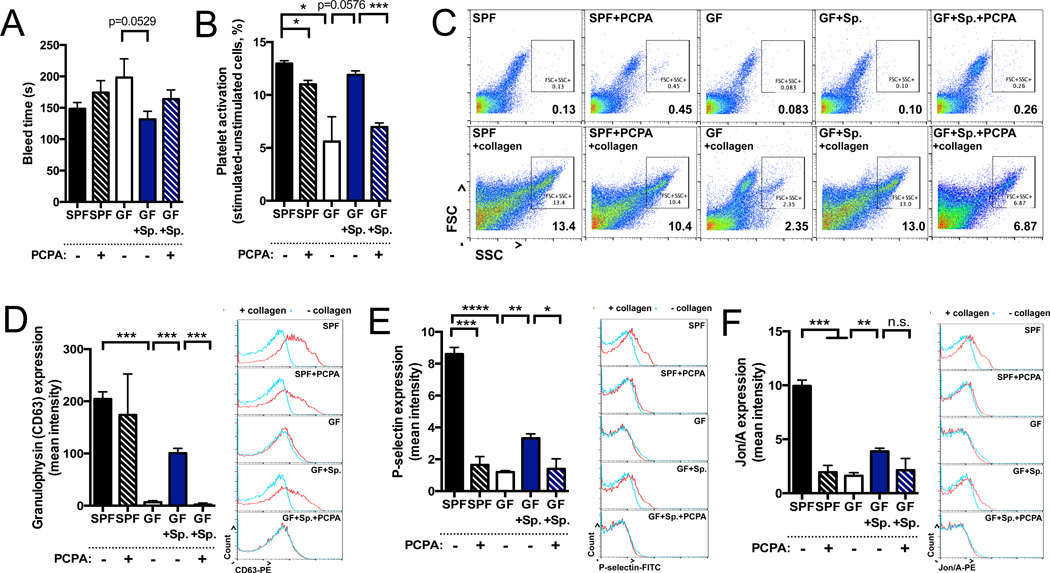
Figure 5. Microbiota-Mediated Regulation of Host Serotonin Modulates Hemostasis.
(A) Time to cessation of bleeding in response to tail injury. n=7–16.
(B) Platelet activation, as measured by percentage of large, high granularity (FSChigh, SSChigh) events after collagen stimulation relative to unstimulated controls. n=3.
(C) Representative flow cytometry plots of large, high granularity (FSChigh, SSChigh) activated platelets after collagen stimulation (bottom), as compared to unstimulated controls (top). n=3.
(D)–(E) Geometric mean fluorescence intensity of granulophysin (CD63; D), P-selectin (E), JON/A (integrin αIIbβ3; F) expression in collagen-stimulated platelets (left). Representative histograms (right) of event count vs. fluorescence intensity (log scale) for platelets treated with collagen (red line) or vehicle (blue line). n=3.
Data for platelet assays are representative of three independent trials with at least three mice in each group. Data are presented as mean ± SEM. *p < 0.05, **p < 0.01, ***p < 0.001, ****p < 0.0001, n.s.=not statistically significant. SPF=specific pathogen-free (conventionally-colonized), GF=germ-free, Sp=spore-forming bacteria, PCPA=para-chlorophenylalanine. See also Figure S5.

