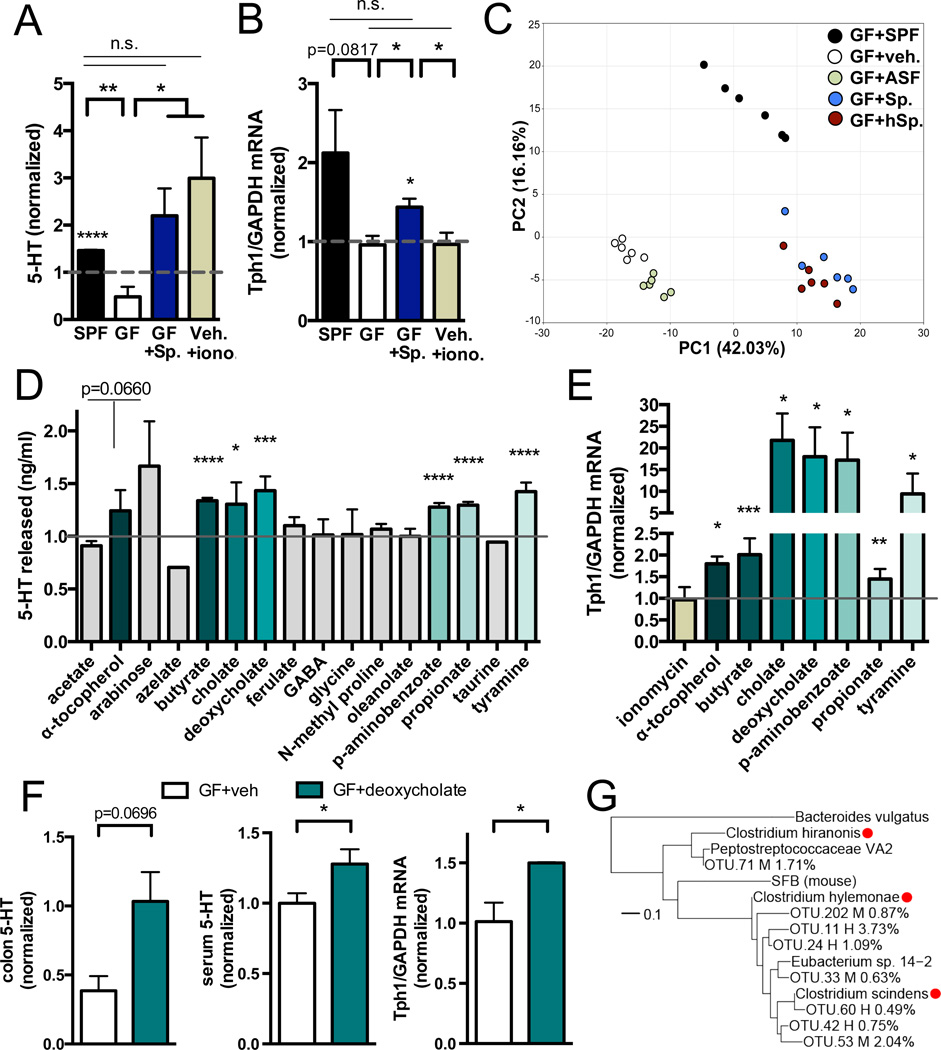
Figure 6. Microbial Metabolites Mediate Effects of the Microbiota on Host Serotonin.
(A) Levels of 5-HT released from RIN14B cells after exposure to colonic luminal filtrate from SPF, GF and Sp-colonized mice, or to ionomycin (iono). Data are normalized to 5-HT levels in vehicle-treated controls (hatched gray line at 1). Asterisks directly above bars indicate significance compared to controls; asterisks at the top of the graph denote significance between experimental groups. n=3.
(B) Expression of TPH1 relative to GAPDH in RIN14B cells after exposure to colon luminal filtrate from SPF, GF and Sp-colonized mice, or to ionomycin (iono). Data are normalized to gene expression in vehicle-treated controls (hatched gray line at 1). Asterisks directly above bars indicate significance compared to controls, whereas asterisks at the top of the graph denote significance between experimental groups. n=4.
(C) Principal components analysis of the fecal metabolome from GF mice colonized with SPF, ASF, Sp, or hSp. n=6.
(D) Levels of 5-HT released from RIN14B cells after exposure to metabolites: acetate (1 mM), α-tocopherol (8 uM), arabinose (50 uM), azelate (50 uM), butyrate (100 uM), cholate (75 uM), deoxycholate (25 uM), ferulate (25 uM), GABA (25 uM), glycine (50 uM), N-methyl proline (0.5 uM), oleanolate (50 uM), p-aminobenzoate (1 uM), propionate (100 uM), taurine (50 uM), tyramine (100 uM). Data are normalized to 5-HT levels in vehicle-treated controls (gray line at 1). n=5–19.
(E) Expression of TPH1 relative to GAPDH in RIN14B cells after metabolite exposure. Data are normalized to expression in vehicle-treated controls (gray line at 1). n=3–4.
(F) Levels of 5-HT in colons (left) and serum (center) of GF mice at 30 min after intrarectal injection of deoxycholate (125 mg/kg) or vehicle. Expression of TPH1 relative to GAPDH (right) at 1 hr post injection. n=3–8.
(G) Phylogenetic tree displaying key Sp. (M) and hSp. (H) operational taxonomic units (OTUs) relative to reference Clostridium species with reported 7α-dehydroxylation activity (red circles). Relative abundances are indicated in parentheses. n=3.
Data are presented as mean ± SEM. *p < 0.05, **p < 0.01, ***p < 0.001, ****p < 0.0001, n.s.=not statistically significant. SPF=specific pathogen-free (conventionally-colonized), GF=germ-free, Sp=spore-forming bacteria, iono=15uM ionomycin, ASF=Altered Schaedler Flora, hSp=humanderived spore-forming bacteria. See also Figures S6 and S7.

