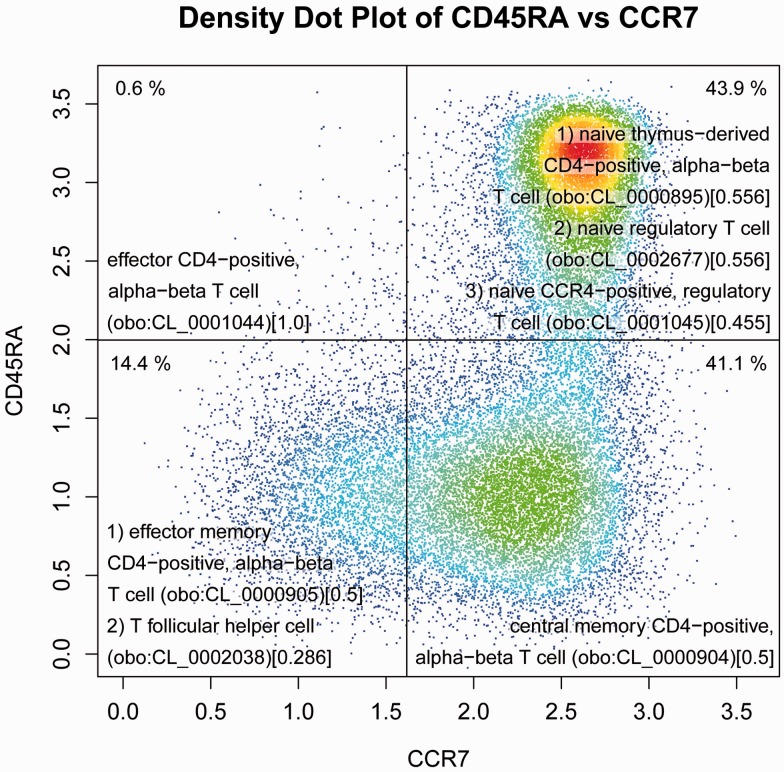
Fig. 1.
Density dot plot of CD45RA versus CCR7 created using flowDensity and using data from Cambridge Institute for Medical Research, after pre-gating to identify live cells, lymphocytes, CD3+, CD4+ and CD8−. Each quadrant has the cell labels that were returned by flowCL for each respective cell population, followed by the CL identifier in parentheses and ranking score in square brackets

