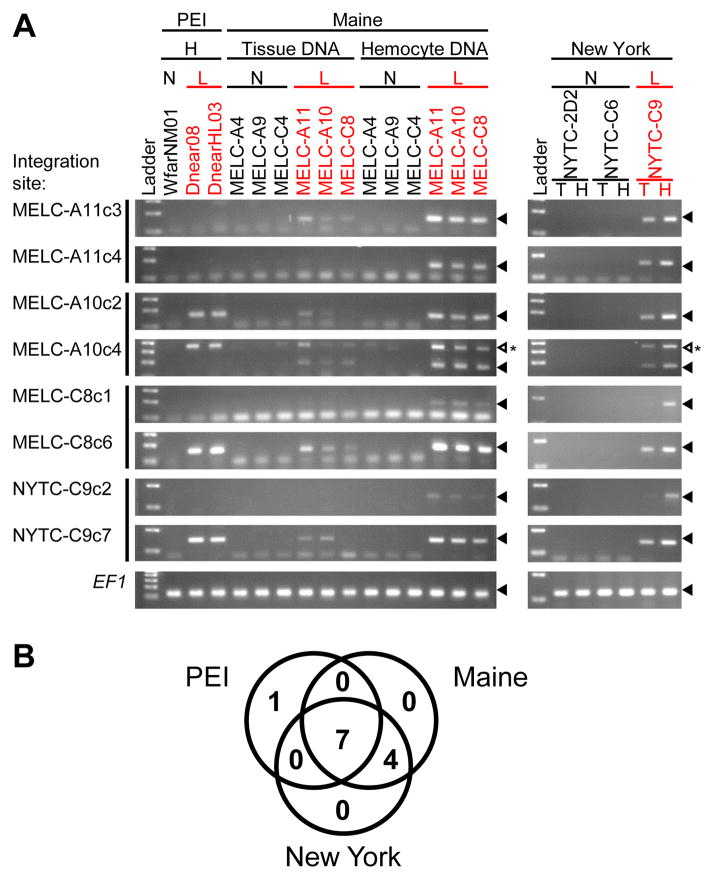
Figure 3. Clonal Steamer integration sites in neoplastic cells.
(A) To determine the presence of specific integration sites in different animals, inverse PCR products were cloned and sequenced from clams from three locations (two integration sites per animal). For each integration site, a reverse primer was designed to match the flanking genomic sequence. Diagnostic PCR using a common forward primer in the Steamer LTR and an integration site specific reverse primer was used to determine the presence of each specific integration site in hemocyte (H) and tissue (T) DNA as indicated, of normal (N) and leukemic (L) clams. Sizes of the amplified DNAs were analyzed by agarose gel electrophoresis. Amplification of EF1 is shown as a control. Filled triangles mark the position of migration of the amplicon. An open triangle marks an unexpected PCR product. This band is due to amplification of a second Steamer integration site present in neoplastic cells of all populations.
(B) Venn diagram of the number of cancer-specific integration sites shared by neoplastic cells from the three locations (out of the 12 sites tested, including 4 sites cloned from PEI samples previously (Arriagada et al., 2014)). None of the 12 sites were present in any normal animal tested.

