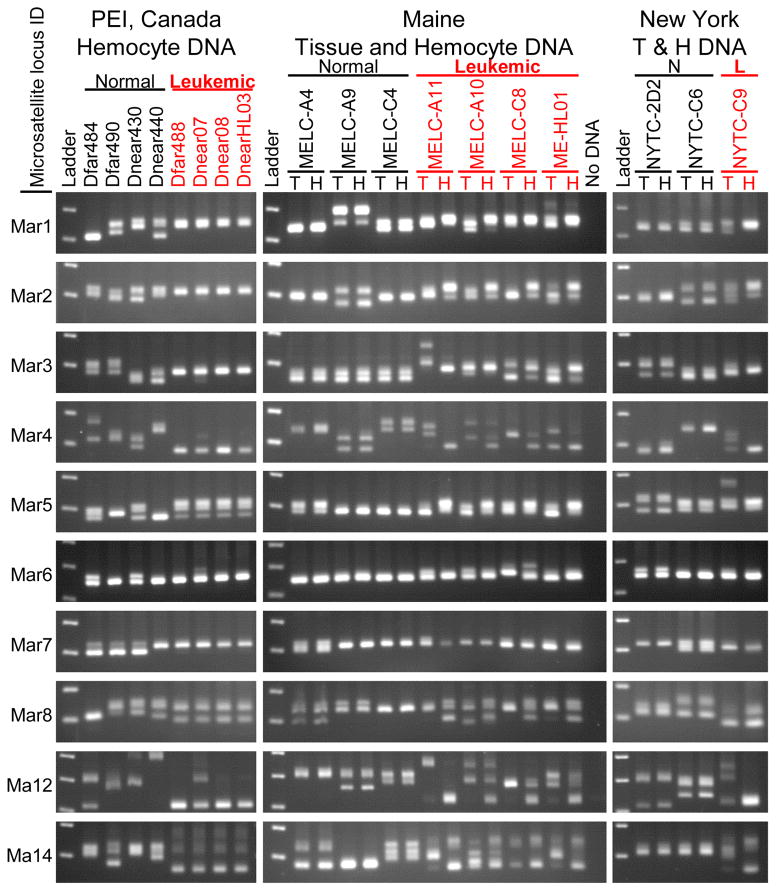
Figure 4. Amplification of microsatellite loci from tissue and hemocyte DNA from normal and leukemic clams.
PCR products using primers flanking ten microsatellite loci in hemocyte DNA and tissue DNA were displayed by electrophoresis on 2.5 % agarose gels and visualized by staining. Different alleles are determined by the sizes of the amplicons, with one band observed for animals homozygous at a particular locus, and two or more for heterozygotes and polyploid neoplastic cells. Each row of gels represents amplification from a single microsatellite locus, as labelled on the left. Hemocyte DNA is shown for normal and leukemic clams from PEI, Canada; and both Tissue (T) and Hemocyte (H) DNA is shown for Maine and New York clams. These data show that the leukemic hemocyte microsatellite alleles are identical to each other and distinct from their host tissue.

