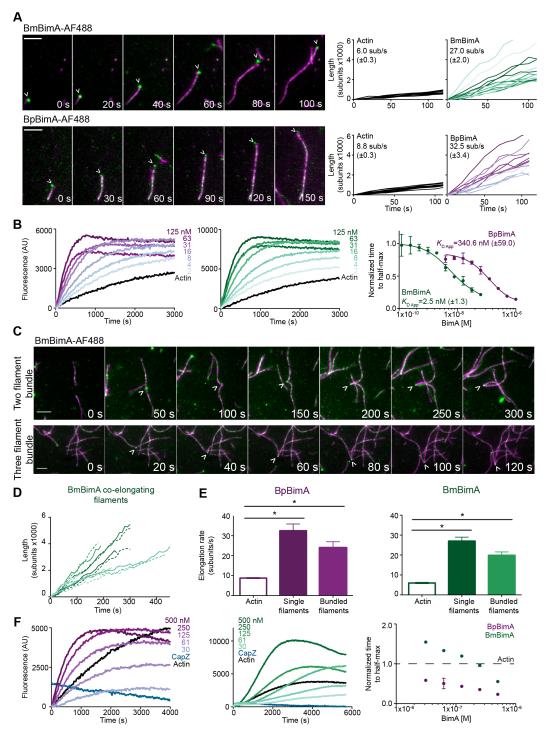
Figure 2. BmBimA and BpBimA processively bind growing filament barbed ends, increase elongation rates, bundle filaments and outcompete CapZ for barbed end binding.
(A) Left, TIRF images showing BmBimA-AF488 and BpBimA-AF488 (green) and rhodamine-labeled actin (magenta). Time (s) is indicated. Scale bars, 3 μm. Right, filament length (number of subunits X 1000) over time for a minimum of 10 filaments with the mean elongation rate (sub/s ± SE) listed. (B) Left and middle, pyrene elongation assays with a range of BimA concentrations. Right, the time to half-maximum fluorescence normalized to actin alone for BmBimA (green) or BpBimA (purple) with the mean apparent KD ± SD listed. (C) TIRF images of BmBimA-AF488 (arrowhead) elongating two (top) or three (bottom) filaments (colors as in A). (D) Graph of filament length (number of subs X 1000) over time for pairs of co-elongating filaments (each pair is in matched colors of solid and dashed lines). (E) Mean elongation rates (sub/s ±SE) for actin alone or for single filaments or two- and three-filament bundles elongated with BmBimA-AF488 (left, green) or BpBimA-AF488 (right, purple). Asterisks denote paired samples that are significantly different (One-way ANOVA; P < 0.0001). (F) Left and middle, elongation reactions first incubated with 10 nM CapZ, followed by BimA and G-actin addition. Right, the time to half-maximum fluorescence normalized to actin alone (dashed black line) for BmBimA (green) or BpBimA (purple). See also Figure S2 and Movies S1-6.

