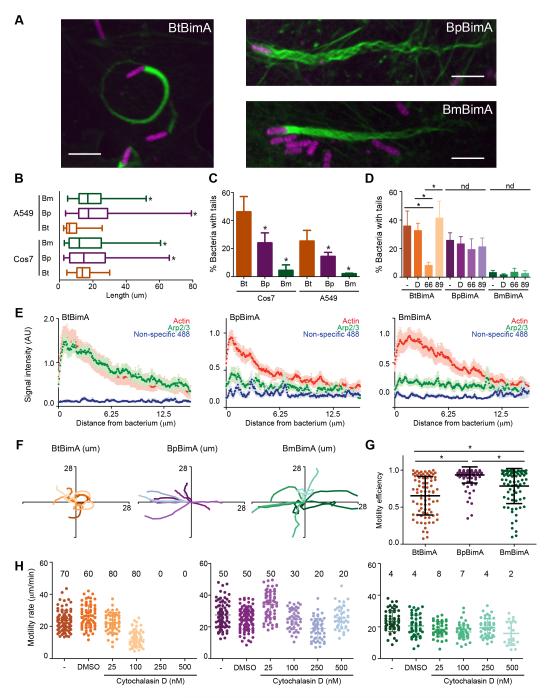
Figure 5. BimA from different Burkholderia species mediates the formation of distinct actin tails and parameters of actin-based motility.
(A) Merged images showing Cos7 cells infected with different Bt strains that constitutively express RFP (magenta). F-actin was stained with Alexa Fluor 488 phalloidin (green). Scale bars, 5 μm. (B) Mean actin tail lengths for the indicated strains in Cos7 and A549 cells. Boxes outline the 25th and 75th percentiles, midlines denote the medians and whiskers show minimum and maximum lengths. Asterisks denote lengths significantly different from BtBimA in that cell type (One-way ANOVA; P < 0.05). (C) Percent bacteria with actin tails (± SD). (D) Percent bacteria with actin tails (± SD) without or with 1 h treatment with DMSO, the Arp2/3 inhibitor CK-666 or the inactive compound CK-689. nd, no difference. (E) Mean actin, Arp2/3 or non-specific 488 nm fluorescence intensities (X 1000) from at least 10 actin tails (± SEM) are plotted along the first 12.5 μm of tail. (F) Tracks (ten per strain) depicting motility over 100 s for bacteria in Cos7 cells. (G) Motility efficiency from at least 80 tracks per strain, calculated as described in the text. (H) Motility velocity over 40 s for each strain in Cos7-Lifeact-EGFP cells untreated or treated with DMSO or CD. Mean frequencies of motile bacteria are listed. For all panels except (B), asterisks denote paired samples that are statistically different from one another (One-way ANOVA; P < 0.0001). See also Figure S3 and Movie S7.

