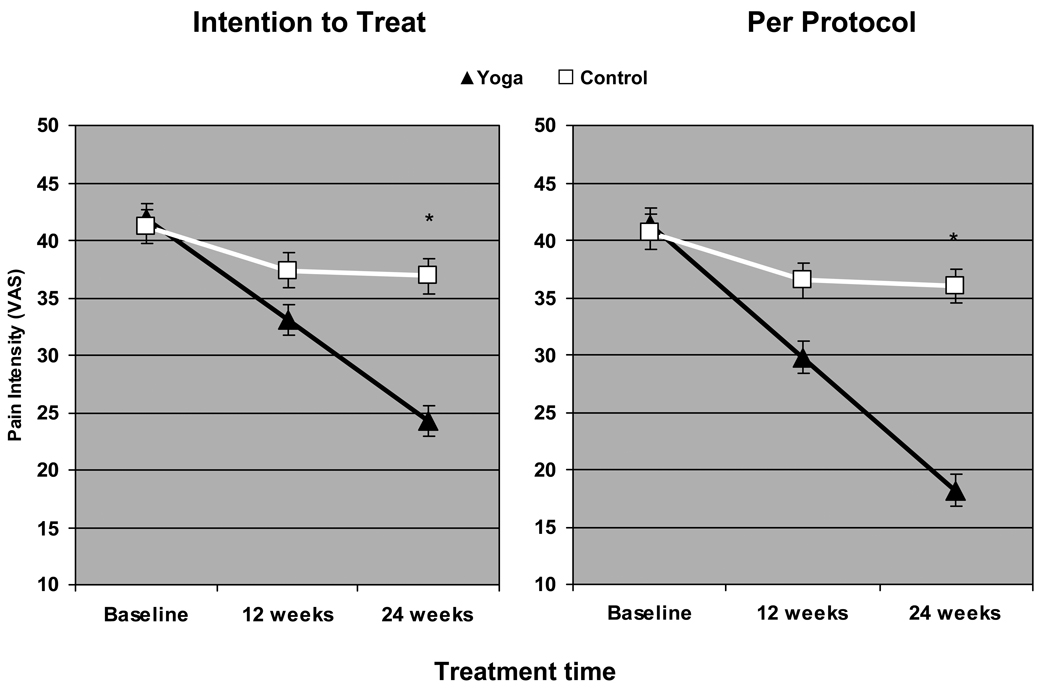
Figure 3. Changes in pain intensity among yoga and control group participants.
The mean pain intensity score (mm on VAS) and standard error of the mean is depicted. The Visual Analog Scale (VAS) is scored from 0–100 with higher scores indicating more severe pain. Statistically significant p values (p < .001) from follow-up linear contrasts at 12 and 24 weeks to the repeated measures ANOVA are indicated by the asterisk (*).

