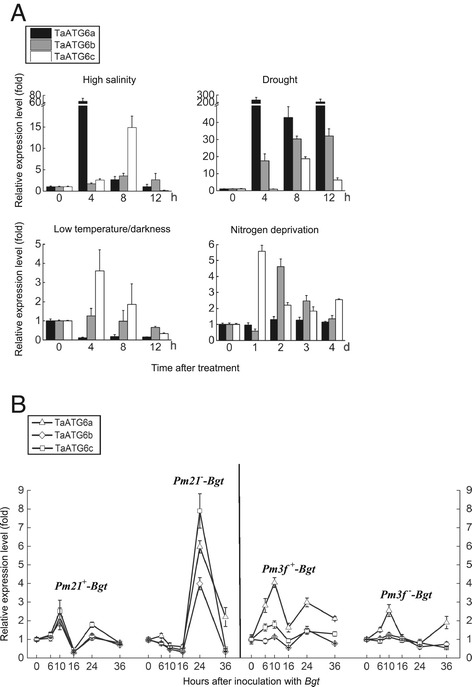
Figure 5.

Expression patterns of wheat autophagy-related ATG6 genes. Two-leaf stage seedlings were subjected to different treatments. Samples were collected at the indicated time points after the initiation of treatment. Total RNA was extracted and qRT-PCR was performed with gene-specific primers. The relative expression levels were normalized by the wheat β-tubulin gene and relative to the control value measured at 0 h. Data represent the mean of three independent experiments ± SD. (A) Expression of wheat ATG6s in response to abiotic stress factors. Yangmai 158 seedlings were transferred to the one-fifth strength Hoagland’s solution containing 200 mM NaCl (high salinity) or 16% PEG6000 (drought). Additional seedling treatments were nitrogen deprivation and exposure to 4°C in the dark (low temperature/darkness). (B) Expression of wheat ATG6s in response to Blumeria graminis f. sp. tritici (Bgt) infection. Pathogen inoculations were conducted by vigorously shaking fresh Bgt conidia from diseased plants onto seedlings of the isogenic lines 92R137/Yangmai 1587 (Pm21 +) and Yangmai 158 (Pm21 −), and the isogenic lines Michigan Amber/Chancellor8 (Pm3f +) and Chancellor (Pm3f −).
