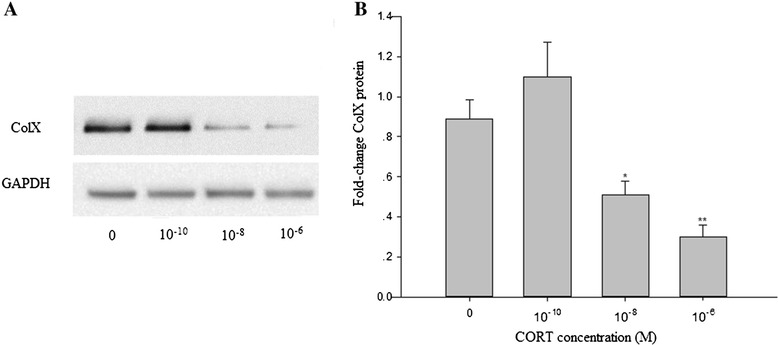
Figure 4.

Western blot for Col X from cultured chondrocytes exposed by different dose of CORT. (A) Immunoreactive bands for Col X and GAPDH protein. (B) Statistical analysis of Col X. Cultures were lysed and protein was extracted, quantitated and analyzed via Western blot analysis. Representative blot for each group from triplicate experiments was shown. Col X protein band density was quantitated by densitometry using the Quantity One software. Col X protein level was expressed as the Col X: Gapdh ratio. *P < 0.05 and **P < 0.01 versus control (0 M CORT).
