Figure 2.

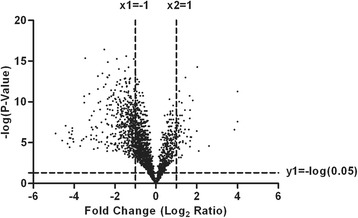
Volcano plots of identified proteins in PsPD vs GBM. The x-axis of the graph refers to the log transformation of fold change, whereas the y-axis of the graph refers to the negative log transformation of the p-value.

Volcano plots of identified proteins in PsPD vs GBM. The x-axis of the graph refers to the log transformation of fold change, whereas the y-axis of the graph refers to the negative log transformation of the p-value.