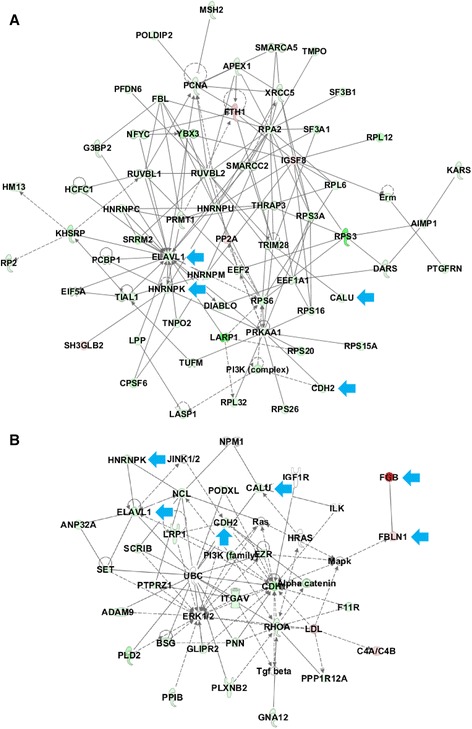
Figure 4.

Cellular growth and proliferation network and protein synthesis network from IPA analysis. Graph A shows the protein synthesis focused network, and Graph B illustratescellular growth and proliferation focused function network. Proteins in red were up-regulated in PsPD compared with N-GBM, and proteins in green were down-regulated in PsPD compared with N-GBM. Proteins pointed by the blue arrow were the selected out candidate proteins used for analysis and further validation.
