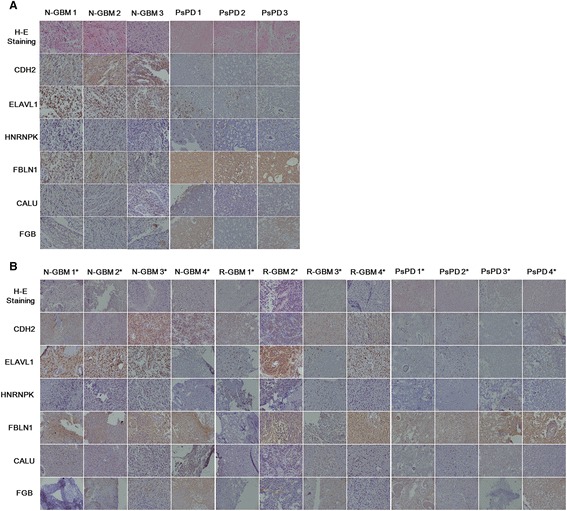
Figure 5.

Results of immunohistochemical analysis of CDH2, ELAVL1, HNRNPK, FBLN1, CALU and FGB in tissue samples. Magnification: 200X. Representative images of paraffin-embedded sections of PsPD and GBM tissue that were HE stained and immunostained for CDH2,ELAVL1, HNRNPK, FBLN1, CALU and FGB. Graph A shows the validation of these six candidate proteins in the six samples used for proteomic analysis. The first three columns show the validation results in N-GBMs and the second three columns show the results in the PsPDs. Graph B shows the validation in an additional twelve samples. The first four column shows the validation results in additionally selected N-GBMs, the second four column shows the results in R-GBMs, and the third four column shows the results in PsPDs. * indicates the twelve additionally selected samples.
