Figure 7.

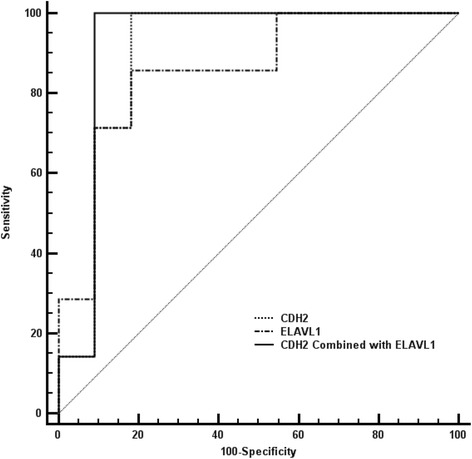
Roc curve of predictive biomarkers. The ROC curve of CDH2, ELAVL1 and the combination of these two candidate proteins was shown in the graph with different lines.

Roc curve of predictive biomarkers. The ROC curve of CDH2, ELAVL1 and the combination of these two candidate proteins was shown in the graph with different lines.