
Figure 7.
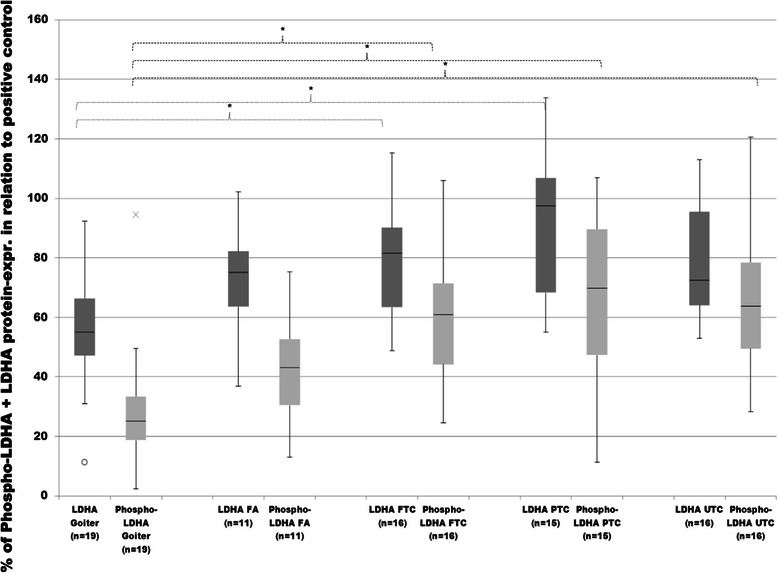
Evaluation of total- and Phospho-LDHA protein expression. Total and y10-phosphorylated LDHA expressions in goiter, FA, FTC, PTC and UTC were analysed by employment of western blot analysis and evaluated densitometrically with ImageJ software. Protein expression was measured in relation to FTC133 as positive control and then normalized to the expression of ß-actin as normalizing marker. Differences are expressed as percent to positive control defined as 100%. *p < 0.05 indicates a statistical significance.