
Figure 8.
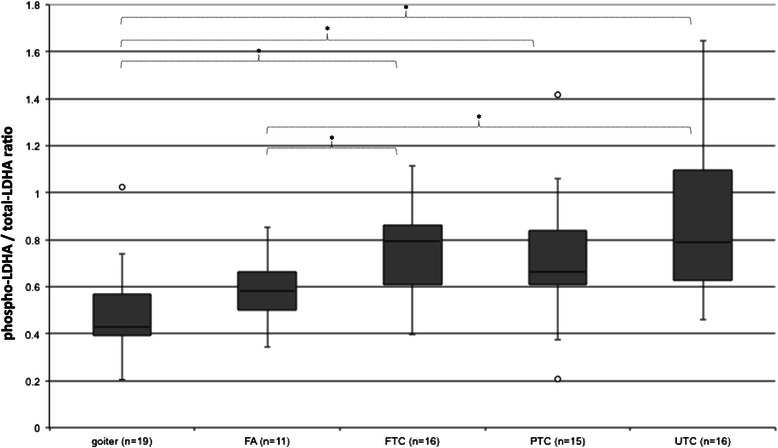
Phospho-LDHA / total-LDHA ratio. Total and y10-phosphorylated LDHA expression in goiter, FA, FTC, PTC and UTC were analysed by employment of western blot (see Figure 1). Phospho-PKM2 / total-PKM2 ratio was built to show phosphorylated PKM2 in relation to total PKM2. *p < 0.05 indicates a statistical significance.