Figure 2.

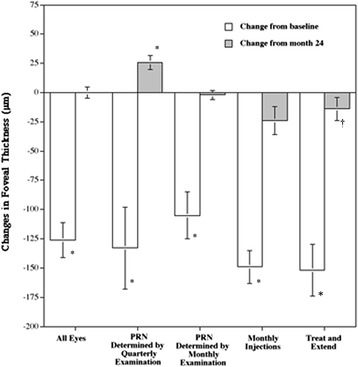
Changes in the foveal thickness at the end of the third year in each treatment schedule. The white and shaded bars indicate changes from the baseline and the 2-year values, respectively. PRN = pro re nata. *P = 0.01; †P = 0.03.

Changes in the foveal thickness at the end of the third year in each treatment schedule. The white and shaded bars indicate changes from the baseline and the 2-year values, respectively. PRN = pro re nata. *P = 0.01; †P = 0.03.