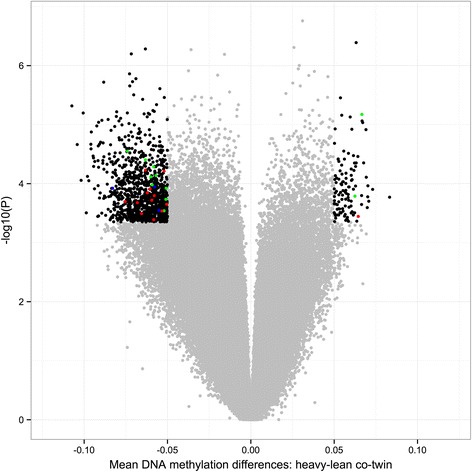
Figure 1.

Volcano plot of differences in DNA methylation between the discordant co-twins ( n = 13 twin pairs) in the eLF group. Each point represents a CpG site (n = 456,961) with mean within-pair differences in DNA methylation between co-twins on the x-axis and − log10 of the uncorrected P value from a paired test (moderated empirical Bayes) on the y-axis. Negative methylation differences indicate hypomethylation and positive differences hypermethylation in the heavy compared to the lean co-twins. Black dots represent significantly differentially methylated CpGs (n = 1,236, FDR <0.05, mean within-pair DNA methylation difference ≥5%); red dots represent CpGs located in genes genetically associated with obesity and obesity-associated traits (T2DM, liver fat, and MetS, n = 13, Additional file 5); green dots represent CpGs located in genes previously shown to be differentially methylated in obesity and T2DM (n = 11, Additional file 6); blue dots represent CpGs located in genes genetically and epigenetically associated to obesity and obesity-associated traits (n = 3, Additional files 5 and 6).
