
Figure 3.
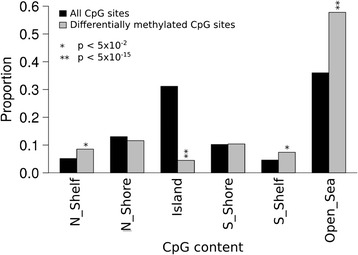
CGIs underrepresented and open seas overrepresented among the differentially methylated CpGs. Bar plot shows the proportions of the differentially methylated CpGs at CGIs, shores, shelves, and open sea and the P values denote which of the CpG categories are over- or underrepresented among the differentially methylated CpGs (n = 1,236) in the eLF group. Fisher’s exact test was used to generate P values for each group to see if they are under- or overrepresented among the 1,236 CpGs. Open sea, isolated CpGs outside any CGIs; shelves, 2 to 4 kb from CGI; CGI shores, <2 kb from CGI.