
Figure 4.
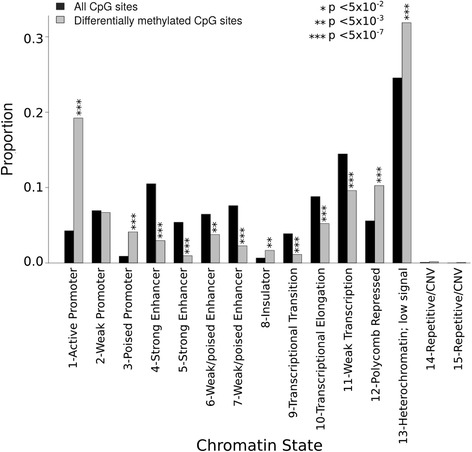
Chromatin states at the differentially methylated CpGs. Bar plot shows the proportions of 15 chromatin states using the Chromatin State Segmentation data from ENCODE/Broad Institute and which of the states are over- or underrepresented (Fisher’s exact test) among the differentially methylated CpGs (n = 1,236) in the eLF group. Chromatin states with identical names differ from each other by the frequency of each mark [58].