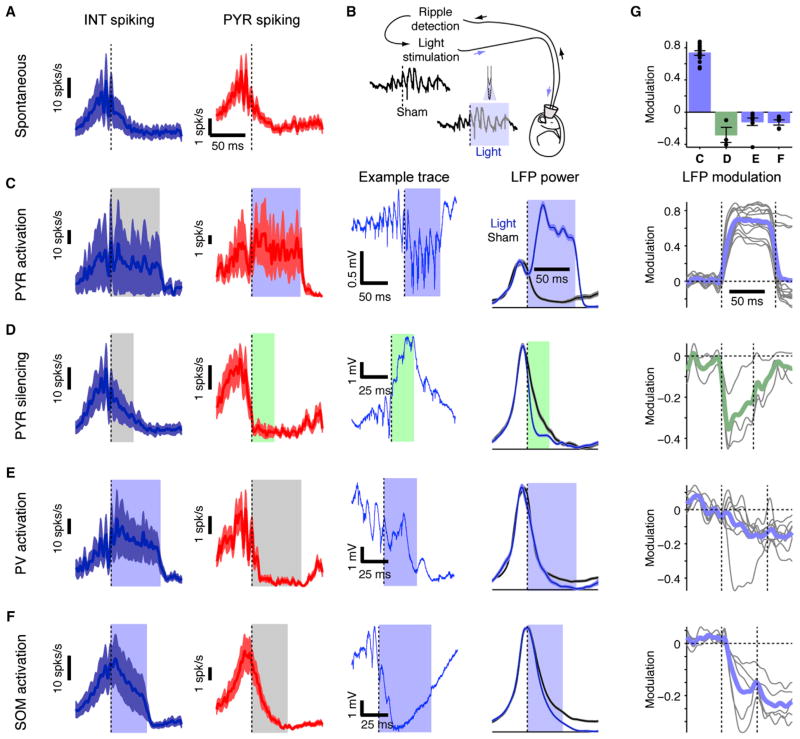
Figure 5. Pyramidal Cell Activity Is Necessary for Ripple Maintenance.
(A) Ensemble spiking activity is oscillatory during ripples. Example shows ripple-triggered peri-event time-histogram during spontaneous ripples (mean ±SEM of ten simultaneously recorded INT, left; and 54 PYR, right).
(B) During closed-loop experiments, ripples are detected in real-time about three cycles after onset, and the detection triggers illumination on one or more shanks. Control (sham) and light trials are interleaved.
(C) Ripple-contingent activation of PYR (single-shank illumination; freely moving CaMKII::ChR2 mouse) drives PYR and increases duration of spontaneously occurring ripples (205 light and 301 sham events; p < 0.001, U test). Example wide-band (1–5,000 Hz) trace shows a single closed-loop event. LFP power: integrated power (80–250 Hz) of the CSD trace in the middle of the CA1 pyramidal cell layer (mean ±SEM) with and without illumination.
(D) Direct silencing of PYR (single-shank illumination; urethane-anesthetized CaMKII::Arch mouse) shortens spontaneously occurring ripples (815 light and 375 sham events; p < 0.001, U test).
(E) Indirect PYR silencing via PV activation (four-shank illumination; freely moving PV::ChR2 mouse) shortens ripples (109 light and 496 sham events; p < 0.001, U test).
(F) Indirect PYR silencing via SOM activation (freely moving SOM::ChR2 mouse) shortens ripples recorded on the illuminated shanks (1,325 light and 1,335 sham events; p < 0.001, U test).
(G) Closed-loop interference with PYR activity disrupts ripples. Modulation: the difference between ripple-power during light and sham trials, divided by the sum. Top: average modulation (mean ±SEM 30 ms postdetection; dots represent individual experiments, repeated 14, 3, 8, and 5 times for [C] through [F], respectively). Panels below show the full time course (colored lines, group averages; gray lines, individual experiments). See also Figure S5.

