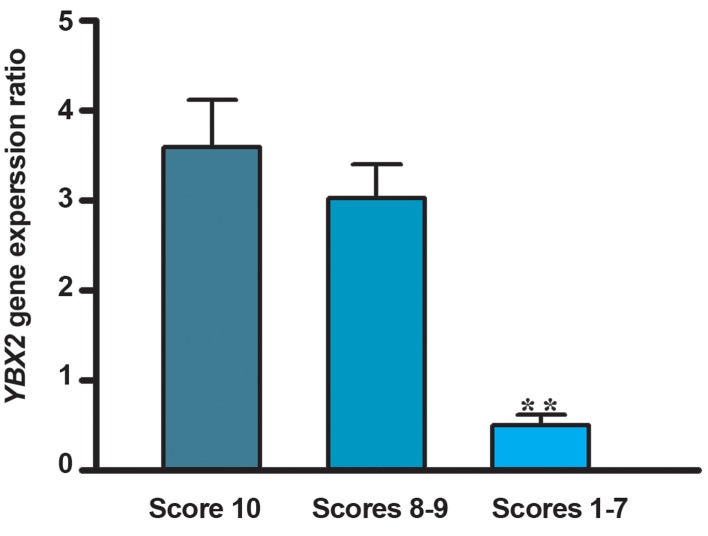
Fig.1.
mRNA expression of YBX2. Men with normal spermatogenesis ( n=12, score 10 ), men with qualitatively normal spermatogenesis ( n=16, scores 8-9 ) and in azoospermic men with impaired spermatogenesis ( n=34, scores 1-7 ). Values are presented as mean ± SD. **; P<0.001 as compared to control groups using one way ANOVA test.
SD; Standard deviation and ANOVA; One-way analysis of variance.

