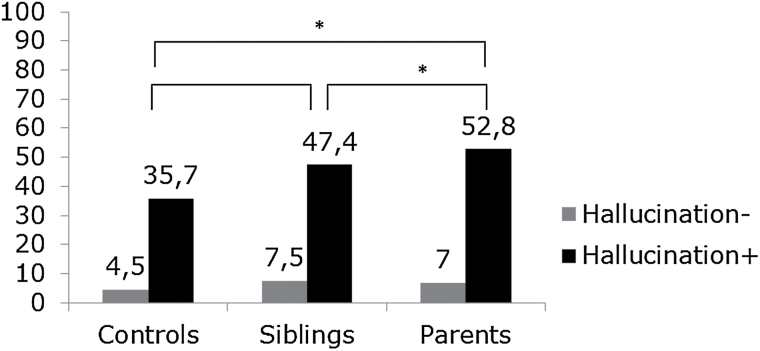
Fig. 1.
Multilevel logistic regression analyses of the probability of delusional ideation as a function of hallucinations, showing differences in the strength of the connection between delusions and hallucinations across 3 groups with variable psychosis risk. 
*p < .05. Hallucination (−)= “no hallucination(s)” and hallucination (+) = “any hallucination.” Grey bars represent the proportion of individuals reporting delusions in the absence of hallucinations; black bars: the proportion of individuals reporting delusions in the presence of any hallucination. Analyses controlled for age, sex, and clustering of observations at subject and family level.
