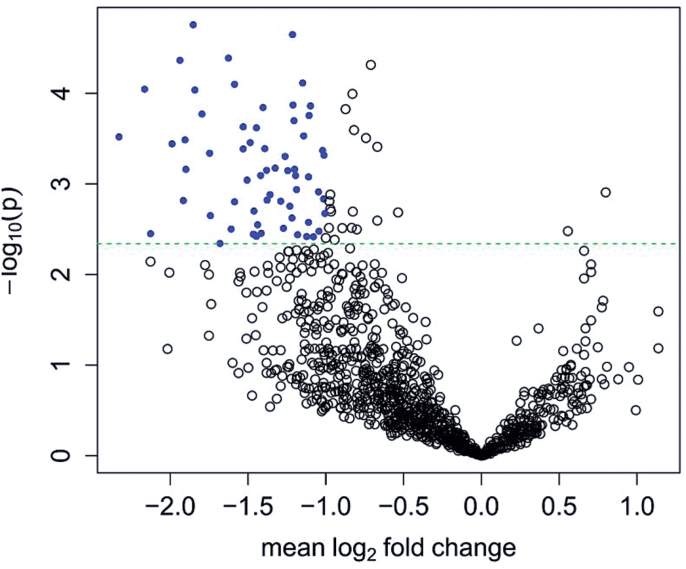
Fig. 2.
Volcano plot of miRNA expressions. Plotted along the x-axis is the mean of log2 fold change, along the y-axis the negative logarithm of the P values. Blue denotes the 63 underexpressed genes. The horizontal green line is the negative logarithm of the adaptive Benjamini and Hochberg-adjusted P value threshold (4.55E-3).

