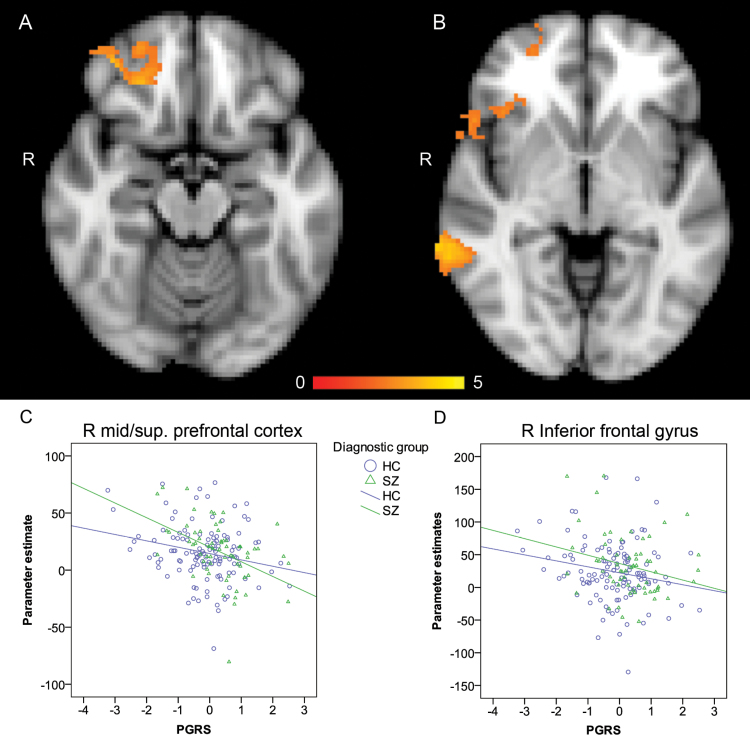
Fig. 2.
A and B: Negative relation between BOLD signal change (2-back > 0-back) and PGRS. (A) z = −16, (B) z = −4 (Montreal Neurological Institute space). Color bar indicates z values. C and D Cluster mean parameter estimates (2-back > 0-back) of patients and controls as a function of PGRS. There were no significant interaction effects between diagnostic group and PGRS. PGRS = polygenic risk score, R = right.

