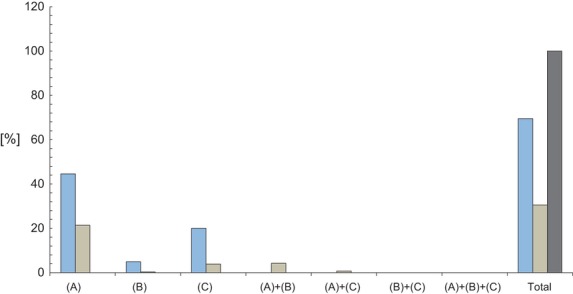
Fig 3.

Relative distribution of Orphan drugs associated to angiogenesis-related rare disease. Percentages of drugs belonging to described subsets of A-RDs: A (A-RDs with cancerous phenotype in all their features), B (A-RDs with cancerous phenotype only in some of their features) and C (A-RDs without cancerous phenotype). Horizontal-axis represents the distribution of drugs in the different subsets. Color code: blue, drugs related to one A-RD; brownish, drugs related to two or more A-RDs; dark grey: total drugs related to A-RDs.
