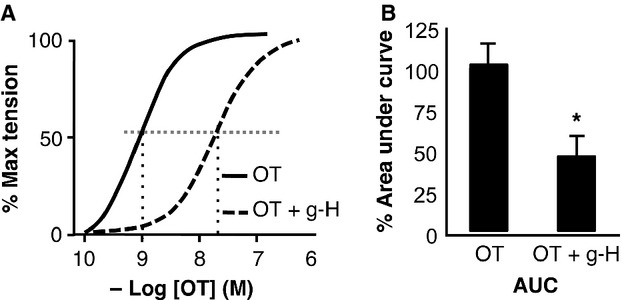
Fig 11.

Effects of inhibition of ROK on activity of human uterine strips ex vivo. Concentration-response curves of uterine strips to OT. The calculated EC50 was 1.3 nM, but in the presence of the ROK inhibitor g-H (1 μM) the EC50 was increased to 27.1 nM. There was a corresponding significant decrease (to 46 ± 15% as indicated by *) in the area under the response curve (n = 4; unpaired t-test).
