Fig 1.

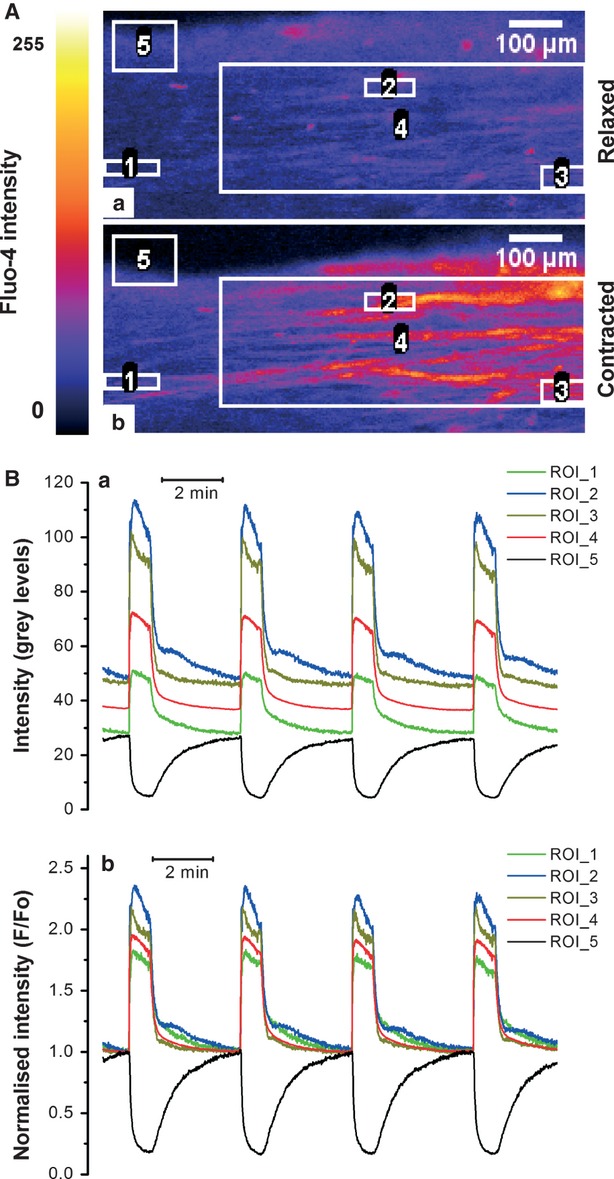
Confocal imaging of spontaneous [Ca2+]i transients and contraction in thin slices of human myometrium. (A) Raw fluorescence images of Fluo-4 loaded myometrial slice in the relaxed and fully contracted state show the arrangement of regions of interest (ROIs) for extraction of the intensity versus time data: single-cell ROIs (ROI 1-3), multi-cell ROI (ROI 4) and a contraction-monitoring ROI (ROI 5) are shown. (B) Intensity versus time traces extracted from the ROI. (Ba) Raw data; (Bb) Normalized intensity showing repetitive increases in [Ca2+]i (red, blue, green and olive traces) and the slice edge displacement indicative of contraction (black trace).
