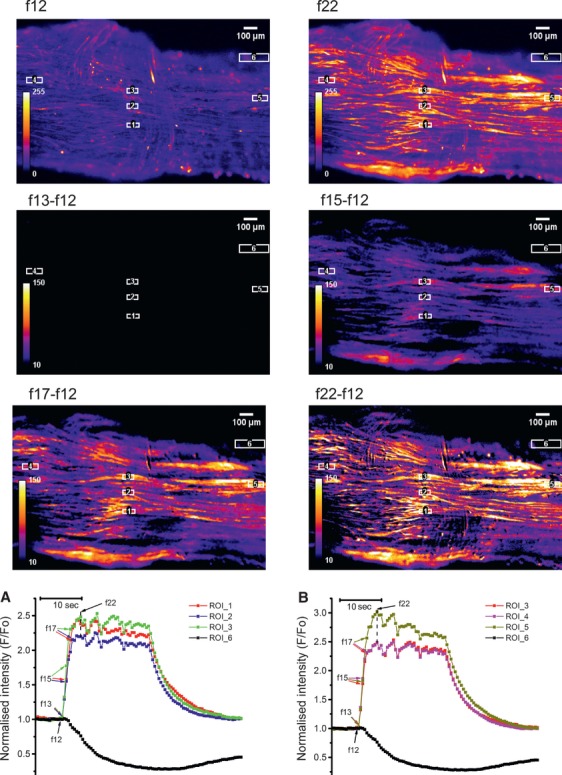
Fig 3.

Synchronous activation of myocytes in myometrial slice containing a single bundle of myocytes. Frames in top row show a Fluo-4 loaded slice at rest (f12) and at peak of [Ca2+]i transient (f22). The ‘resting fluorescence’ frame (f12) was subtracted from subsequent frames during the rising phase of [Ca2+]i transients to yield the ‘delta F’ images where cells are visible only when they rise [Ca2+]i above the resting level. The ROI were positioned along the longitudinal axis (ROI 4, 3 and 5) or perpendicular to it (ROI 1-3). Graph in (a) shows [Ca2+]i traces extracted from ROIs positioned in longitudinal direction. Graph in (b) shows [Ca2+]i traces extracted from ROIs positioned perpendicular to the longitudinal axis. Black traces correspond to a contraction-monitoring ROI 6. Arrows next to frame numbers in both graphs indicate data points corresponding to the corresponding frames shown above. Note that [Ca2+]i transient spread between cells in both sets of ROIs without measurable delay indicating synchronous activation of cells in both directions.
