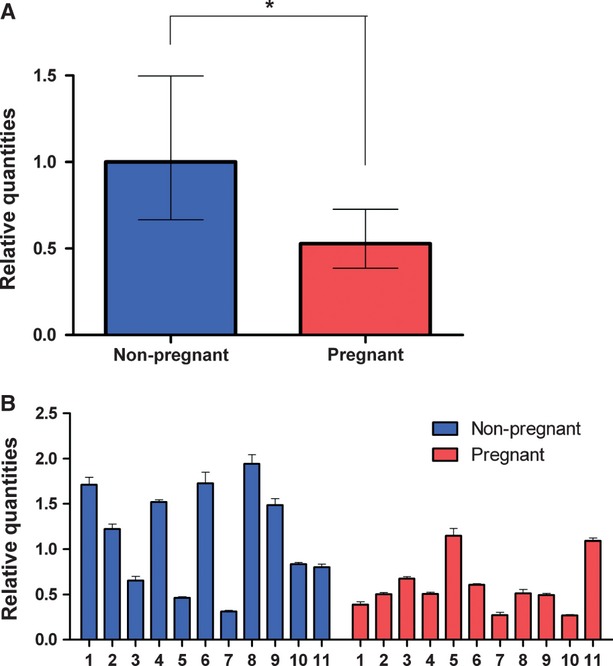
Fig 5.

KCNN3 expression measured by qRT-PCR. The relative expression of KCNN3 is normalized to the geometric mean of the most stable reference genes, SDHA and TOP1. Bar chart showing expression of KCNN3 in non-pregnant (blue, n = 11) and pregnant (red, n = 11) (A) Bar chart showing KCNN3 expression in each patient (B) Values are presented as mean ± S.E.M. *P > 0.05.
