
Fig 3.
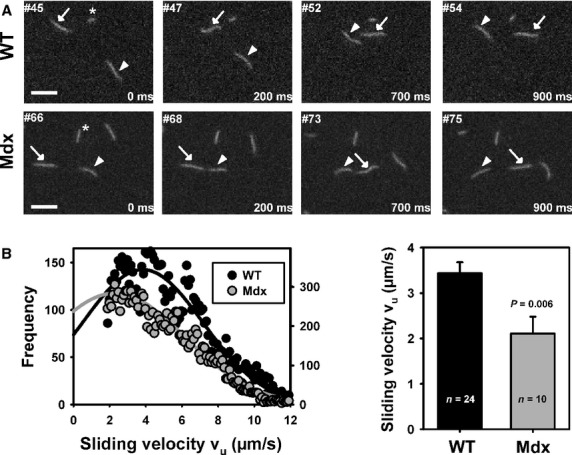
In vitro motility assay in ventricular myosin extracts from young wild-type (wt) and mdx mice. (A) Example images from two motility assay XYT stacks of wt and mdx myosin extracts. Arrows and arrowheads point towards individual actin filaments tracked in successive images. Image frames and times relative to first frame are indicated. The asterisk points towards a standing filament that does not move in successive images indicative of rigour bridges that introduce artificially high counts velocities <1.5 μm/sec. (B) Velocity distributions from two individual XYT recording sequences (n = 24 for wt; n = 10 for mdx) showing the Gaussian fits for the velocities from several hundreds of tracked filaments. There is a prominent left shift of the mdx curve. The results from several thousand filaments confirmed a significantly shifted velocity towards smaller values in mdx hearts.