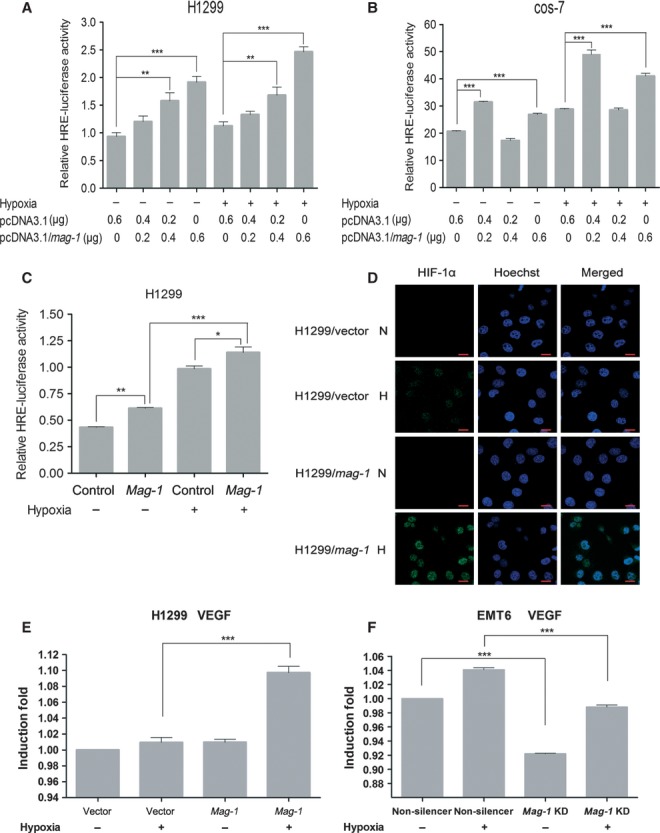
Fig 5.

mag-1 potentiates the transcriptional activity of HIF-1α under hypoxia. (A) and (B) H1299 cells and COS-7 cells were plated 18 hrs before transfection by Mega Tran 1.0 (Origene) according to the manufacturer's instructions. The following plasmids were co-transfected into cells: 500 ng HRE-Luc in combination with 0.5 ng of the Renilla internal control CMV-pRNL (Promega, Madison, WI, USA), and 0.2, 0.4 or 0.6 μg pcDNA3.1/mag-1. After transfection, cells were cultured 6–10 hrs under hypoxia or normoxia conditions. The total amount of DNA transfected was adjusted to 0.6 μg with pcDNA3.1 (mock). (C) Stably transfected H1299/mag-1 cells and mock control were transfected only with HRE-Luc Luciferase and Renilla internal control plasmids. Luciferase activities were measured 24–36 hrs after hypoxia using the Dual-luciferase reporter system according to the manufacturer's protocol (Promega). The ratio of Firefly/Renilla luciferase activity was determined in relative light units (RLU). The data shown are from a representative experiment performed in triplicate. Bars show the standard error of the mean. Statistical significance was determined using One-way anova with non-parametric analysis comparing data points to the scramble or mock control. **P < 0.01; ***P < 0.001. (D) Comparison of HIF-1α expression between H1299/mag-1 and H1299/vector control cells under normoxia condition or exposure to hypoxia for 12 hrs using immunofluorescent staining. The representative results were observed and photographed under Zeiss Confocal laser-scanning microscope. Scale bars represent 20 μm. (E) and (F) Real time PCR analysis were performed in triplicate in three independent experiments to confirm the effect of manipulating the expression of mag-1 gene on HIF-1-induced VEGF mRNA expression in H1299 (E) and EMT6 (F) cells under normoxia and hypoxia conditions. GAPDH was used to normalize the quantitative real time PCR results. The results are presented as bar graphs showing the means ± S.D.
