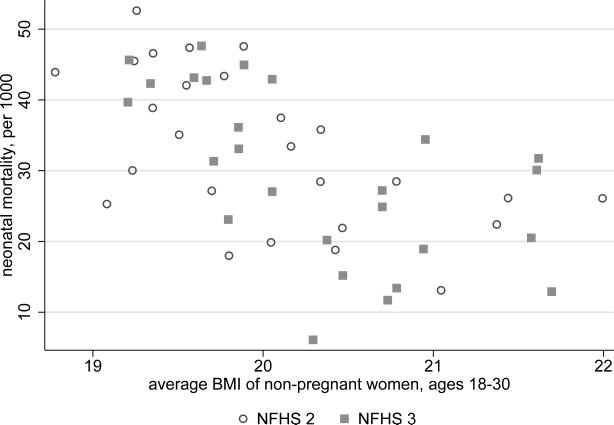
Figure 5. State level variation in women's body mass correlates with neonatal mortaity.
Observations are states in the NFHS 2 and the NFHS 3. The horizontal axis plots the average body mass index score of non-pregnant women age 18 to 30; these ages are the 10th and 90th percentile ages among pregnant women in both the NFHS 2 and the NFHS 3. The vertical axis plots neonatal mortality, the fraction of infants born in the three years before the survey who died in the rst month of life.

