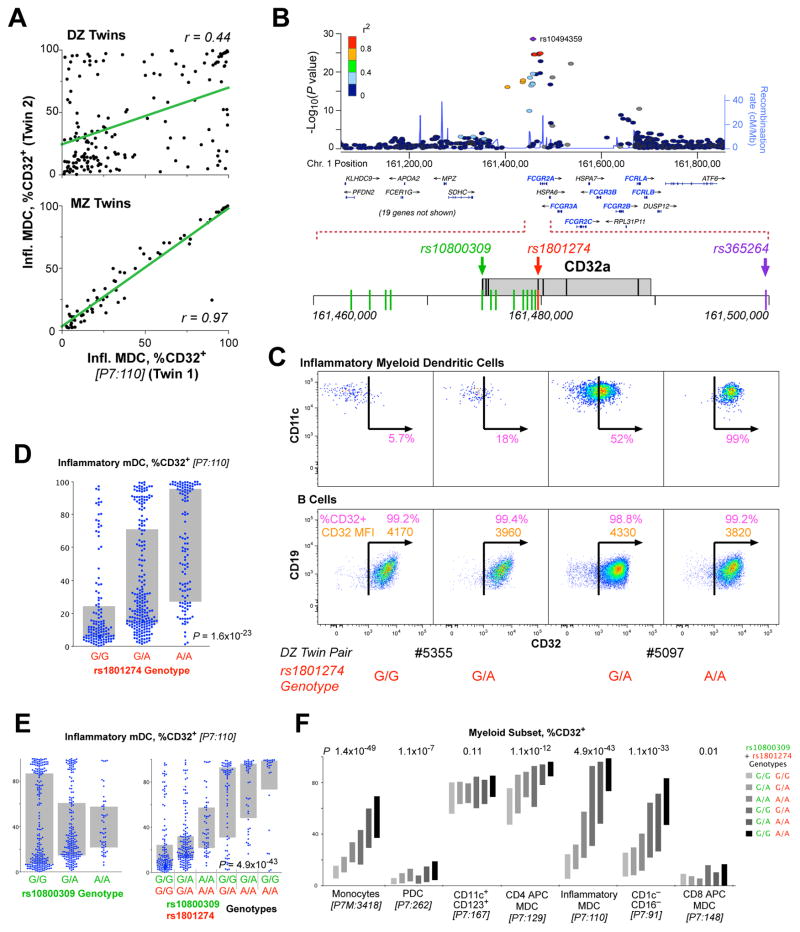
Figure 4. Genetic associations of the FcR locus with myeloid immunophenotypes.
(A) The correlation of the fraction of imDCs that are CD32+ for dizygotic twins (upper) and monozygotic twins (lower). The linear correlation, r, is shown for each comparison. (B) Organization of the FcR locus of chromosome 1 showing the position of immunologically relevant genes (shown in gray boxes). The positions of three SNPs are highlighted in color; rs1801274 and rs10800309 are the two that are most closely associated to susceptibility to SLE. SNP’s shown in green were in complete linkage disequilibrium within the samples analyzed in our cohort. (C) Sample expression profiles of CD32 on imDCs (upper) and B cells (lower). Shown are the fraction of cells that are CD32+ (in pink) and, for the B cells, the CD32 SPEL (in orange). Two pairs of dizygotic twins discordant for the genotype at rs1801274 are shown. (D) The distribution of expression of CD32+ imDCs is shown by genotype at rs1801274. (E) The expression of CD32 on the imDCs is not significantly associated with the genotype at rs10800309 by standard ANOVA (p = ns); however, the distributions are clearly different by genotype. The combination of the genotype at rs10800309 and rs1801274 provides a dramatic distinction for the expression of CD32 on imDC. (F) The expression profile of CD32 on seven different myeloid populations is shown, broken down by the combined genotype of the two SNPs. Bars indicate interquartile range.

