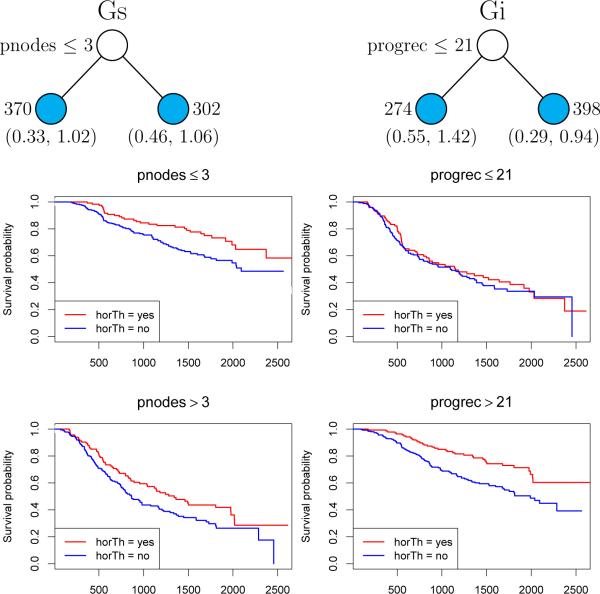
Figure 1.
Gs (left) and Gi (right) tree models and Kaplan-Meier curves for breast cancer data. At each intermediate node, an observation goes to the left child node if and only if the displayed condition is satisfied. Sample sizes are beside terminal nodes; 95% bootstrap confidence intervals of relative risks for therapy versus no therapy are below nodes.

