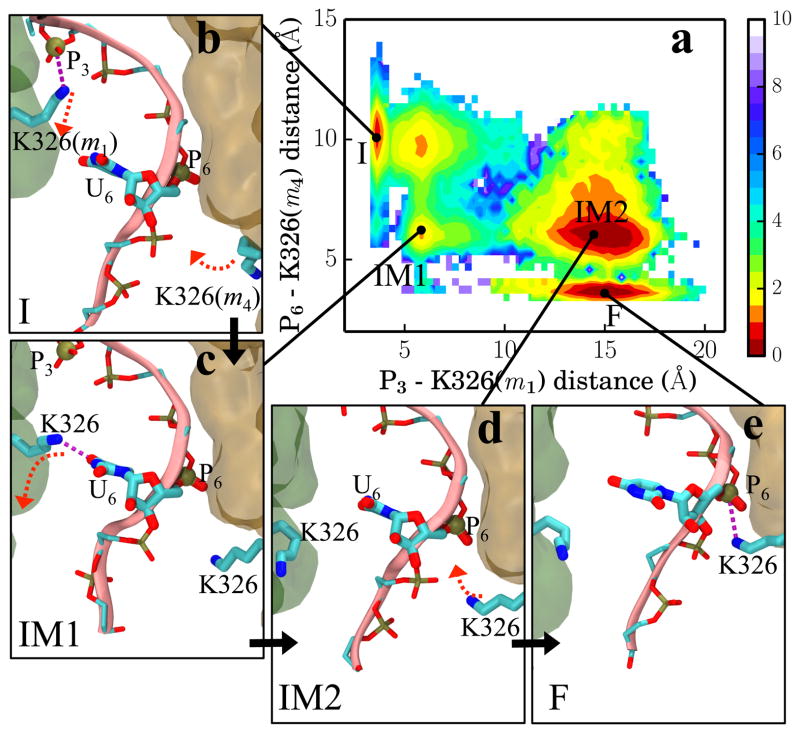
Figure 4.
Key interactions between RNA and Rho during the I → F transition. (a) Free energy landscape along distances P3-K326(m1) and P6-K326(m4). The position of the phosphorus atoms of the phosphate group and NZ atoms of K326 define the corresponding distances. (b–e) Configurations in states I, IM1, IM2 and F, accounting for the key steps of RNA binding and release that induce RNA translocation. Red dashed arrows indicate large side chain movements before the next state is reached. m1 (green) and m4 (orange) are shown in transparent surfaces.

