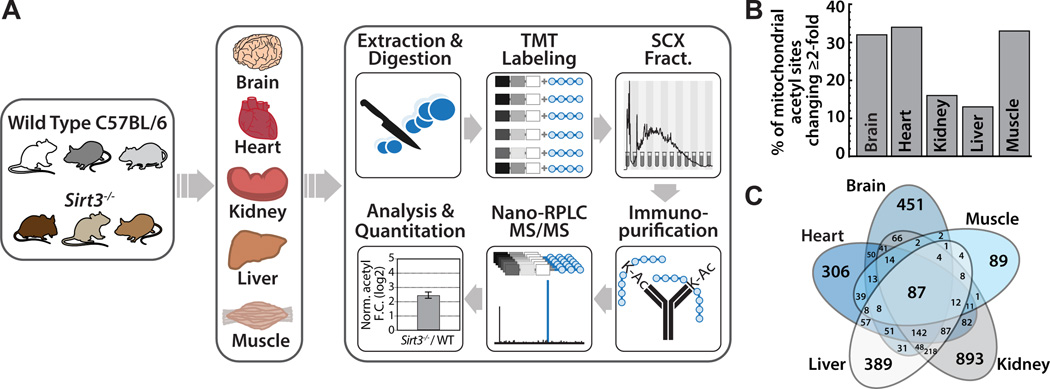
Figure 1. Multi-tissue quantitative acetylome experimental workflow and metrics, see also Figure S1, Table S1, Table S2.
(A) Wild type and Sirt3−/− mouse brain, heart, kidney, liver, and skeletal muscle were compared in biological triplicate. Tissues were disrupted by bead milling and extracts were digested. Peptides were labeled with TMT reagents, combined and fractionated by strong cation exchange chromatography. Acetyl peptides were enriched by immunoprecipitation and analyzed via nano-RPLC MS/MS on an Orbitrap Elite.
(B) Percentage of mitochondrial acetyl sites changing ≥ 2-fold in the Sirt3−/− condition for each tissue. Calculated as number of mitochondrial acetyl sites changing ≥ 2-fold per total number of quantified mitochondrial acetyl sites found in that tissue.
(C) Venn diagram displaying overlapping acetyl sites between tissues.

