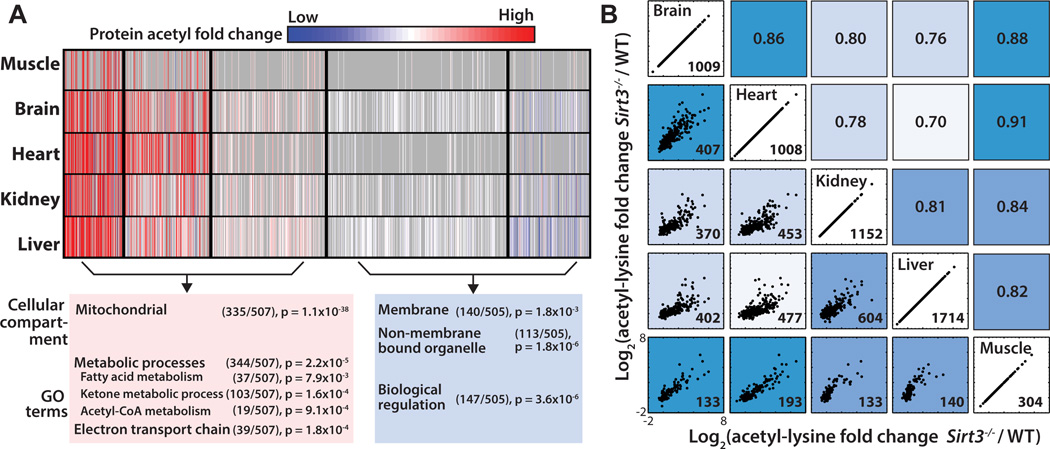
Figure 3. Tissue specific patterns of acetylated proteins and tissue correlation analysis, see also Figure S3.
(A) Cluster analysis of acetyl-proteins identified 5 clusters that define 2 groups based on their overall trends between Sirt3−/− and WT. Acetyl-proteins are color coded according to their normalized fold change between Sirt3−/− and WT with cluster separations are denoted by black lines. Each row represents a tissue and each column represents an acetylated protein. Red: Increased acetylation, Blue: Decreased acetylation, Gray: Missing. Pathway analysis, number of acetyl proteins and p-values for enrichment are shown for two main groups of acetyl-proteins.
(B) Normalized acetyl fold changes plotted for sites found in common between any two tissues. Scatter plots on the left side of the diagonal with the number of sites quantified and plotted in the lower right hand corner. Axes scales are equivalent for each scatter plot. Corresponding Pearson correlation coefficients are indicated on the right side of the diagonal. Tissues with acetyl sites behaving more similarly in response to Sirt3−/− are more highly correlated and are a darker shade of blue.

