Figure 3.

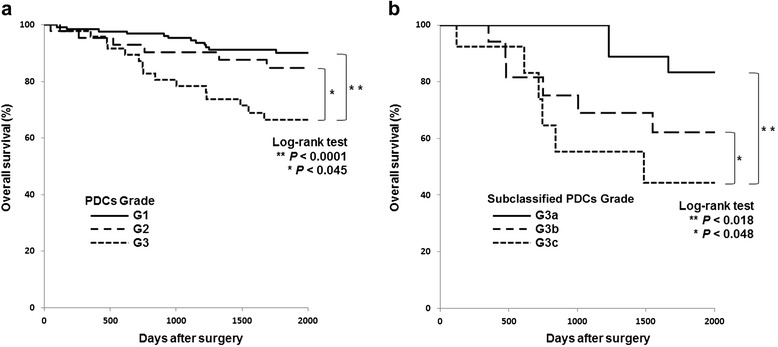
Overall survival curves. (a) Overall survival curves according to the highest poorly differentiated cluster (PDC) grade (left) and (b) according to subclassified G3 PDCs (right).

Overall survival curves. (a) Overall survival curves according to the highest poorly differentiated cluster (PDC) grade (left) and (b) according to subclassified G3 PDCs (right).