
Figure 4.
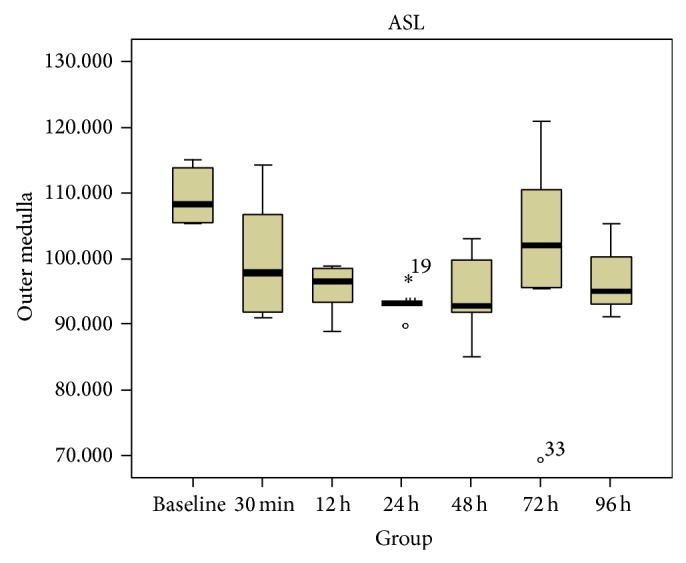
Box plots of RBF values in OM. The circle and asterisk mean the outlier and extremum respectively. This box plot implied that the 50% of the values at 12 h, 24 h, 48 h were lower than baseline.
Official websites use .gov
A
.gov website belongs to an official
government organization in the United States.
Secure .gov websites use HTTPS
A lock (
) or https:// means you've safely
connected to the .gov website. Share sensitive
information only on official, secure websites.
Box plots of RBF values in OM. The circle and asterisk mean the outlier and extremum respectively. This box plot implied that the 50% of the values at 12 h, 24 h, 48 h were lower than baseline.