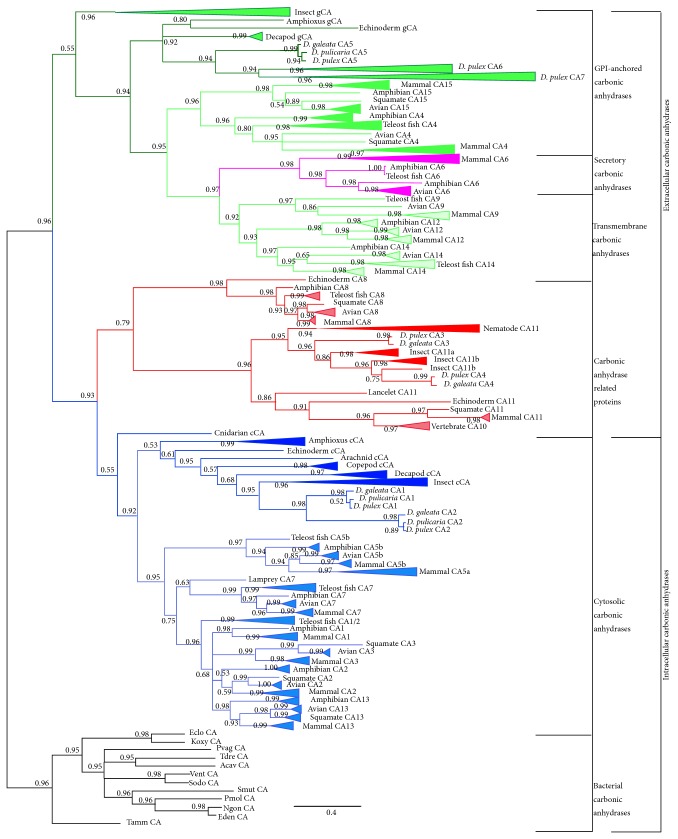
Figure 1.
Phylogeny of α-CAs inferred from a maximum likelihood analysis performed with MrBayes; posterior probabilities of branches are indicated at the nodes. Species are collapsed within a larger taxonomical grouping. Branches are colored according to alpha-carbonic anhydrase families: GPI-anchored (dark green: invertebrate; medium green: vertebrate), membrane-bound (light green), secretory (purple), CA-RP (red), and cytosolic (dark blue: invertebrate; light blue: vertebrate). Black branches represent the bacterial outgroup α-CA families.

