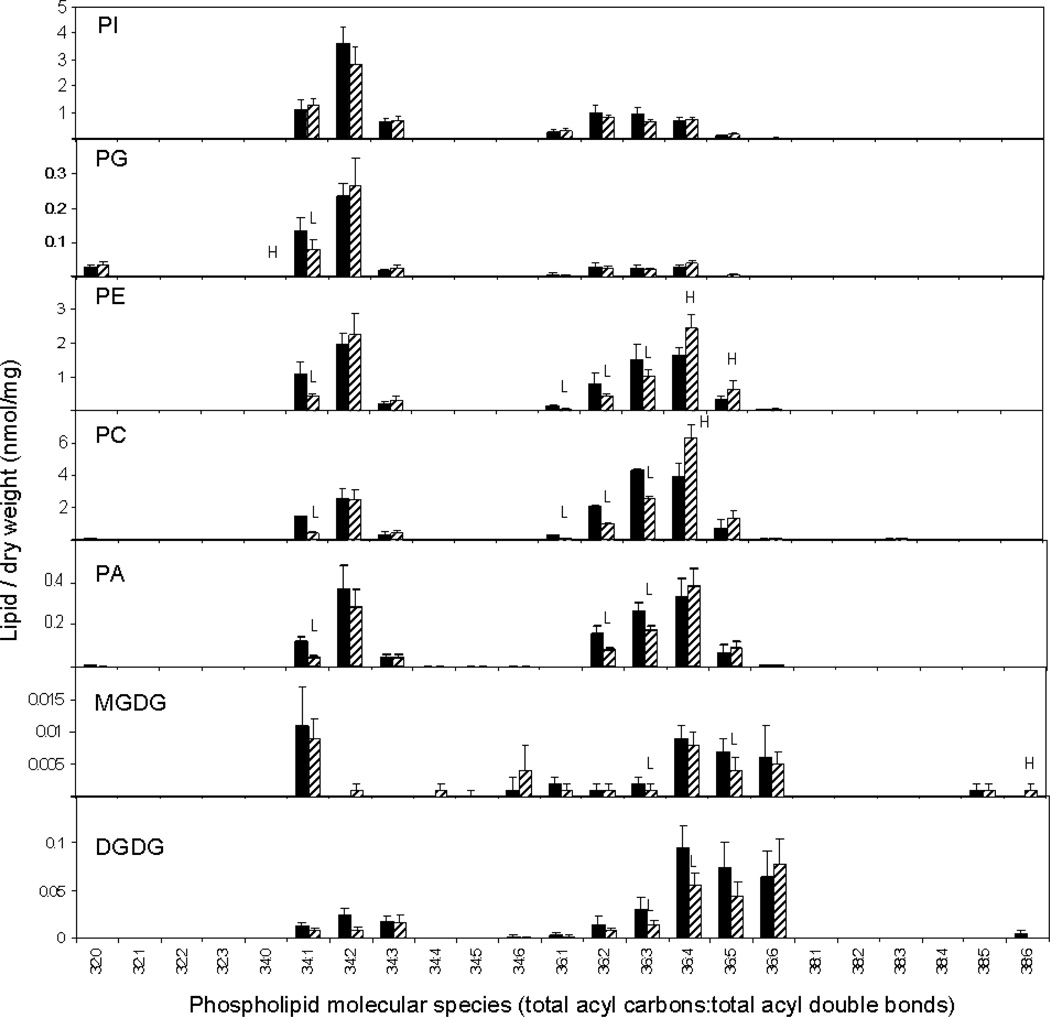
Figure 5.
Lipid molecular species of mature soybean cotyledons as revealed by ESI-MS/MS. The black bars represent non-transgenic soybean cultivar, Fayette, and the hatched bars represent PLDα-suppressed transgenic soybean, SW. The values are the mean + SD (n = 5). An H or L indicates that the value is higher or lower than that of non-transgenic soybean at p<0.05 level, respectively. PI; phosphatidylinositol, PG; phosphatidylglycerol, PE; phosphatidylethanolamine, PC; phosphatidylcholine, PA; phosphatidic acid, MGDG; monogalactosyldiacylglycerol, DGDG; digalactosyldiacylglycerol.

