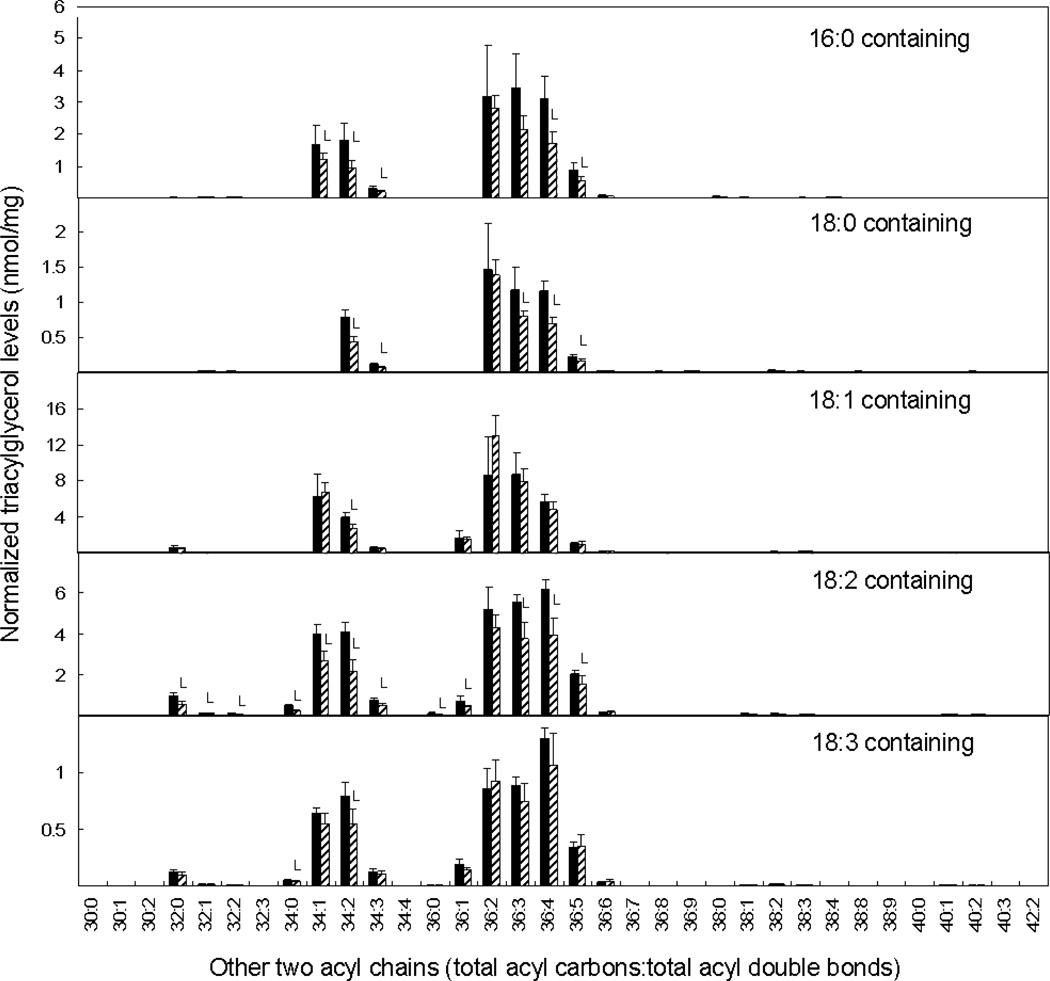
Figure 8.
Triacylglycerol molecular species in PLDα-attenuated soybean seeds. The black bars represent non-transgenic soybean seeds, and the hatched bars represent PLDα-suppressed transgenic soybean seeds. The values are mean + SD (n=5). An L indicates that the value is lower than that of non-transgenic soybean seeds at P<0.05 level. Each panel depicts amounts (normalized to an internal standard and to dry weight) of a subset of triacylglycerol species containing a particular fatty acid. The y-axis indicates the identity of the other acyl chains in the TAG molecular species as total acyl carbons and total double bonds, combined for the other two acyl chains. Note that the same molecular species may be detected in more than one panel.

