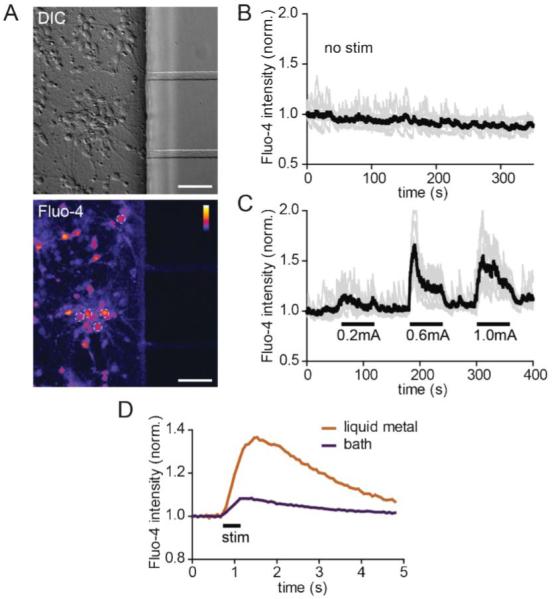
Fig. 3.

Neuronal activity is induced via the liquid metal electrodes. (A) DIC (top) and a static image of fluo-4 labeling (bottom) within the cell channel after stimulation. The white dashed circles show 5 of the 7 soma regions of interest (ROIs) used to generate the graphs in B and C. Color lookup table, “Fire”. Scale bar, 50 μm (B) Baseline fluorescence intensity of individual ROIs (light gray) and average for all ROIs (black) without stimulation. (C) Fluorescent intensity readings of individual and averaged ROIs during alternating stimulation and rest periods. (D) Averaged soma response using liquid metal and bath electrodes. P < 0.001 using two-way ANOVA. Fluo-4 intensities for all graphs are normalized to initial values.
