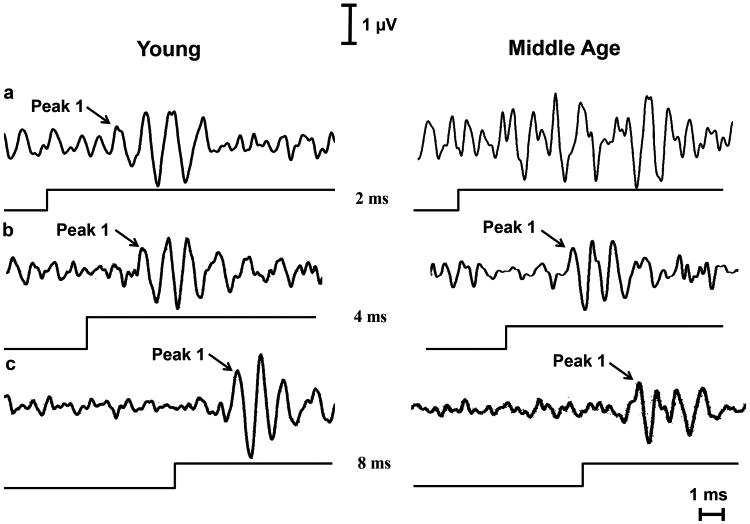
Fig. 4.

A representative of a waveform analysis between Y and MA that was used to determine the minimum gap threshold (MGT). MGT is defined as the lowest gap duration at which there is a NB2 response. a) At 2 msec, MA doesn't have a NB2 response; however, Y clearly displays ABR waves. Therefore, the MGT for group Y is 2 msec. b) By 4 msec, MA starts to show signs of P1 waveform. As a result, the MA group has a MGT of 4 msec. c) At 8 msec, both groups also show P1 waveforms. However, the Y peaks are notably larger than MA's. The line underneath each audiogram indicates the point in time at which the NB2 stimulus was given.
