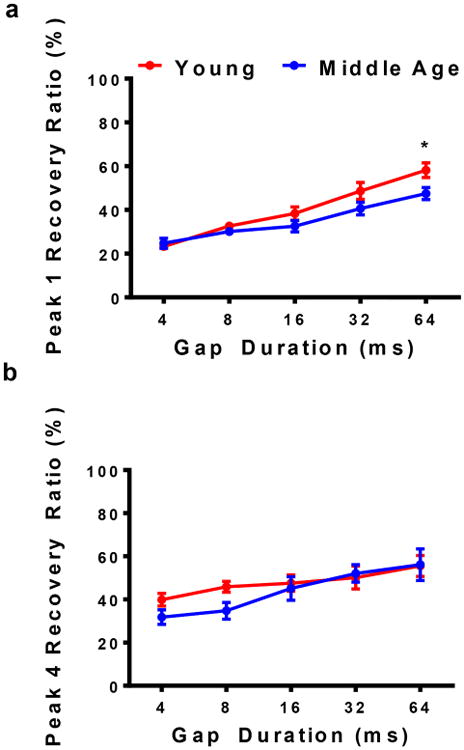
Fig. 6.

a) Recovery ratios for P1 were analogous for Y and MA at 4msec. However, ratios for the Y group began to improve as gap durations became longer. Significant differences can be seen between the groups at 16 and 64 msec. b) Conversely, recovery ratios for P4 vary greatly at 4 msec. By 32 msec, the MA group starts to recover almost as well as the Y group. The Y group displayed higher percentage values for wider GIN durations for P1. For P4, higher Y percentages could be seen for smaller GIN durations. Statistical tests: ANOVA followed by Bonferroni; *p<0.05.
